In his “career” as a “baseball writer,” the author has abused the generosity of his employer constantly — in no greater a capacity than in the production of a metric called NERD, by means of which metric he has attempted to render objectively the aesthetic appeal of this particular pitcher or that particular club to the sort of educated and bespectacled people who read the internet weblog FanGraphs.
Of late, it has occurred to me that I could attempt to produce a similarly useless — and therefore worthwhile and virtuous and admirable and worthwhile — thing for world football. What follows is the result of that attempt.
There are a number of ways to construct such a metric, of course. What I’ve endeavored to do, however, is more or less reverse engineer my own tastes — which, owing to how I’m not that special, very likely at least resemble the tastes of other people, as well.
My ambition, then, was to isolate those characteristics which facilitate appealing team football. My process for doing that is one which I have zero interest in documenting here — not because it’s very secret, but rather because the prospect of rendering it into prose is burdensome.
As for discussing the product, however, that’s less of a burden. The absurd metric in this case isn’t called NERD, but rather Style Points. Because of Whim, is why. The two inputs for Style Points are average short passes per match (per Who Scored) and also estimated roster value (per Transfer Markt). The first number serves as an able proxy, it seems, for aesthetically appealing play. The second one I’ve utilized as a proxy for a club’s fiscal resources — the rationale being that, between two clubs with similarly appealing play, the one which has cost less is more virtuous.
To calculate Style Points, what I’ve done — after identifying short passes per match and estimated market value for every club — what I’ve then done is to calculate the z-score (that is, standard deviations from the mean) of shorts passes and market value for each club relative to that club’s respective league, multiplying the latter figure by -1 to denote how greater club value is actually a detriment. Following that, I’ve multiplied the market-value z-score by 0.5, to give it less weight than the short-pass component. I’ve then added the z-scores together, multiplied the result by five, and then added five — in order to distribute all the resulting figures over an approximate scale of 0 to 10 for each league.
By way of example, consider the case of Arsenal. Arsenal currently average 505 short passes per match — this figure, relative to an EPL average 394 short passes per match and standard deviation of 75. That gives Arsenal a z-score of +1.5 by this measure. The total estimated market value of Arsenal’s roster, meanwhile, is about £315 million — this, relative to an EPL average of about £163 million per club and standard deviation of £123 million, giving Arsenal a z-score of about -1.2.
Having calculated those two z-scores, I multiplied the latter (market value) by 0.5. Adding the product of that calculation to the first (short-pass) z-score, I then multiplied that sum by five, and then added five — a process which (again) naturally distributes all the resulting numbers over an approximate scale to 0 to 10. The result for Arsenal by this method: 9.4, which figure I then rounded down to 9.
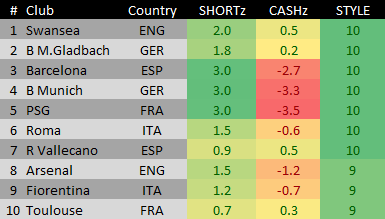
Applying that same methodology to each of Europe’s five major leagues, here are the top-10 clubs by Style Points:
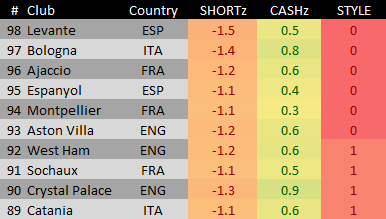
And also the bottom 10:
And finally some notes of varying import:
- The presence of Swansea atop the leaderboard — and the presence of Barcelona, too — is encouraging for different reasons. The former club plays an excellent brand of football relative to its fiscal resources; the latter is appealing despite is considerable spending.
- The absence of both Chelsea (5) and Real Madrid (6) from the top heights of the leaderboard also suggests that there’s something like justice at work.
- A slightly unkempt Excel file including all 98 European clubs is available here.

This is excellent work. I would say that my viewing pleasures closely resemble yours, however, given the data were available, I probably would have included through balls in my metric as they tend to strongly correlate with goals.
It would appear that you prefer Ligue 1 (average Style Points = 4.95) to all other leagues. You seem to enjoy the German brand of football the least (average Style Points = 4.20).
1) I’m curious about the portion concerning the rationale behind the following:
“I’ve then added the z-scores together, multiplied the result by five, and then added five — in order to distribute all the resulting figures over an approximate scale of 0 to 10 for each league.”
2) And then also as to why any team with a raw score in excess of 10, gets a Style Points value of 10.
Can you please expand on these two points further? Perhaps they are related.
Thanks
Basically I just wanted to translate the results from a scale with which people, including myself, are less familiar (i.e. z-scores) to one with which they’re more familiar (i.e. 0-10). Saying that Arsenal are have a “style score” roughly 0.9 standard deviations better than average among EPL clubs is less intuitive, I think, than saying they get a 9 on a scale of 0-10.
That’s why I capped the scores at 10, too. A couple clubs went over that mark; one or two went below zero. It looks weird, though. And no one suffers from just saying “Everything will just fit on a scale of 0-10.”
You can convert z-scores into its value in a normal distribution by making the z-score the first parameter in the Excel function NORM.S.DIST(z,cumulative). [make the cumulative parameter TRUE] This will take any z-score and translate it into its value on a normal distribution (i.e. a number between 0-100). It’s a little more pure than using subjective coefficients.
Why not shots on goal?
Note: This is a question from a powerfully ignorant man.
When NERD was first introduced I thought about how a football version might work. Good stuff. What do you suppose would be the football equivalent of the knuckleball factor?
Hi Carson, just doing some calcs for fun (I know, on a sunday morning). I checked the style points for the Dutch league and was not surprised. However, I was wondering what the correlation was between team value and actual results (current points total, in this case) I found that the Dutch league has an r of 0,71, which translates excellently to your weighed factor of 0,5. Then I got interested in the r for the EPL. There I foound that the r between team value and points scored to this date is 0.87. This number translates to a factor of 0.75, if you calculate the explained variation. If you apply this to the EPL, the leader would still be Swansea, with a much wider margin. The big market/money clubs woulld be lower down in the order, with Chelsea at a miserable 1 point.
In short, I think that there should be some sort of league adjustment factor in this otherwise BRILLIANT and somewhat thougtprovoking excercise to quantify watchability.
Also, completely agree with Mr. Jack R. to make the normal distribution for this kind of analysis.